Weekly Look Ahead
Further confusing the issue is the matter of sector cyclicals. Start with the sector chart below.
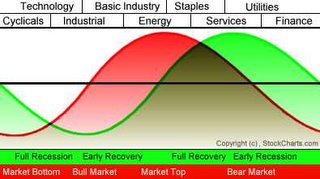
Typical economic sector behavior: red is the typical stock price cycle, green is the economic cycle, and the areas across the top are the sectors that do well.
Now compare this to the chart below of sector performance for the third quarter. Utilities and Technology doing well would suggest we are somewhere in the lower half of this market cycle! Figure in the other performance and if you believe in using sector performance to time the market we would still be in the upswing. Contrast this with recent weakening in housing market and industrial orders on the East Coast and the overall image is a confusing one.
Last quarter sector data, compared to the sector cyclical chart above, paints a confused picture that would suggest almost anything except perhaps that the market has reached its top.
Going into next week everyone is going to be looking for the market to crest that psychologically important all-time-high milestone. There are a lot of important reports coming out next week though, so keep your seatbelt fastened as it could be a choppy ride.
posted by FinanceWonk at 8:49 PM
![]()
![]()

0 Comments:
Post a Comment
<< Home