Present Value Analysis - Fundamentals
Introduction
The value of a company can be expressed in many ways. There are a wide variety of ratios and numbers that people will throw around when talking about what a stock, and therefore the underlying company, is “worth.”
Ultimately, however, stock value is about profits. If I try to sell you shares in XYZ company and XYZ has no profits and will never have any profits, presumably you wouldn’t buy the shares. Think about it this way: if you buy the shares and hold them forever the company will eventually be gone without you getting any money, if you try to sell before “forever” the buyer would face the same analysis and won't buy them from you. Some stocks seem to do awfully well without profits because people believe that the business can generate profits later. TiVO, for example, frequently argues that they could instantly start generating profits if they stopped paying to increase customer count and just kept raking in the dough from current customers.
How does one value profits in the future, or the growing revenue of a company making profits today?
The value today of a dollar tomorrow
Some call it “Present Value Analysis” or “Intrinsic Value” of any of a number of other names. The core concept is the same: the value of a dollar profit today is greater than the value of a dollar profit next year. How much greater is governed by something called the “Discount Rate”, as in “how much of a discount would you expect if you were buying a dollar’s worth of next years profit.” Clearly it depends on how the transaction takes place. If you’re buying with the full guarantee of the US government that’s a treasury bond and the rate is right around 5% as of this writing. You would expect the government to pay you 5 cents to use your dollar for the year or, said another way, you would pay about $95 and get $100 back in a year. You should expect to get more of a discount with riskier assets where the return is not as certain, so with stocks the Discount Rate is higher. Exactly how high will be revisited in a little bit. I use 15% a lot so I’ll use that in some of the examples here.
The next concept to add to the equation is the power of compounding. At a 6% discount rate $100 next year is worth about $95.24 today, but if you push that $100 out to two years away it is only worth $90.70. The present value can be calculated by dividing the eventual value by (1+discount rate) to the power of the number of years involved. A 6% discount rate applied to $100 over 30 years gives a price of 100/(5.74)= $23.14. To give you a better feel for compounding I’ve made a chart of the present value of $100 at various distances in time. Two discount rates are shown: 6% and 15%. At a 15% discount rate the value of $100 in 30 years is only $1.51 today. That means if someone tries to sell you XYZ stock saying that each share will earn nothing for 30 years followed by $100 in the 30th year and then the company will close, the present value for that share at a 15% discount rate would be $1.51.
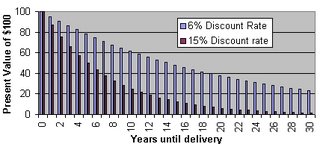
The present value of $100 delivered at various distances into the future based on different discount rates. Note the curved nature of the value over time (due to compounding) and the dramatic effect of different discount rates.
Applying this to long term profits
Now we’ve seenn how to arrive at a present value of XYZ stock if the company has a strange business plan where all the profits will be released at one point in 30 years. Let’s complicate things by jumping straight into a real world company. Lincoln Electric Company [LECO] has a BUY rating from me as of this writing so let’s paw through the earnings. Last years earnings were $136.8 million, and analyst’s average growth estimates are 19% per year. For the moment let’s not question those numbers (although before proceeding with a real analysis you should always question those numbers). The chart below shows the next ten years of projected profits using these numbers. I have captured the excel boxes that go into the chart as well for those who are interested. Each year’s profit is just 1.19 times the previous year’s to get 19% growth (you can program this in by setting each earnings box ={box to the left}*1.19 ).

We can figure out the present value of each year’s earnings by dividing it by one plus the discount rate (15% here) to the power of the distance in years to that date. For example in the third year the earnings would be divided by 1.15*1.15*1.15 = 1.52. Here’s a picture of what this looks like; the present value of the profits is actually rising somewhat because the growth rate is higher than the discount rate. Frequently you see the present value bars declining.
LECO projected earnings again, this time combined with discount rate calculations for each year to show the present value of each year's profit. It is common to see the present value bars shrinking in future years because most companies don't have growth rates greater than the discount rate the way LECO does. The total present value is arrived at by summing up the values represented by the blue bars. Year zero is last year, so it doesn't show up in these calculations.
Several things are evident from this chart. One is that there is no value to the year zero earnings because those earnings are in the past. The other is that we now have a means to value each year’s worth of earnings back to the present in a way that captures the increasing uncertainty of events farther in the future and the limited value of money that you don’t have yet. If you add up each of those present values to see how much the company is worth today you get $1.659 billion for the next ten years.
The next issue is “how long will the growth continue?” In a case like LECO where the projected growth rate is higher than the discount rate, the company would be worth an infinite amount if it could keep growing at the present rate forever. This is true but if you run the numbers it is a pure impossibility because the company would rapidly have everyone on earth working for them, which is clearly not what will happen. In reality companies slow down as they age. Mature companies that are still managed well typically grow profits slightly more than the GDP or inflation (otherwise they need to change their business, but that’s a different issue). After 10 years I like to change a companies growth down to 6% and also, because big slow companies are less risky, set a discount rate of 12% (we will address where these numbers are coming from later on). To get the profit for years after the 10th I multiply the previous year by 1.06. To get the discount I start with the 10 year discount (4.046, equal to 1.15 to the 10th power) and multiply by 1.12 to the power of the number of years after the tenth, so the discount in year 30 is ( 4.046*(1.12^20)= 13.7 ). Thirty years is a useful cutoff because by then the power of compounding has drastically reduced the value of future earnings and the impact on the analysis becomes small. Thirty years is also enough time for major technologies and products to come and go, so who knows what the company will be doing then. The chart below shows earnings and present value of earnings for 30 years. Right around year ten you can see a change in the curve of the projected profits. It’s hard to see due to the chart scale but the present value of the earnings is dropping off by the end. I haven’t tried to show the 30 columns of excel.

The final sum of the present value is about $4 billion. If you subtract off the current long-term debt of $155 million and add in the current cash and receivables (bills sent out to customers still awaiting payment) of $359 million you get a net present value of $4.2 billion. Divide that by the current number of shares of LECO (42.43 million) and you get a net present value per share of $99 (versus a current price around $50).
This is how many analysts get target prices. Now you can do it at home on a spreadsheet.
(One note is that I often use a calculation that goes out past 30 years, although the impact is somewhat minor from the later years due to the large discount.)
It is a good idea to turn this calculation around and see what growth rate is needed to justify the CURRENT stock price. For LECO I get about 8.6%. Although you can solve for this directly sometimes it’s educational to set your spreadsheet to calculate a share value based on a growth rate and then play around with the growth rate to find the current price (this is what I do). This number tells you what growth rate management must have to not have the stock go down – which is a useful number to keep in mind. If there is a lot of cushion between this number and what you expect from the stock it can be very reassuring.
This example has been extremely positive. LECO is a very nice stock with solid profits and good growth. I think if it were in a sexier field it would have been bought up long ago, and now that it’s being put into the S&P index it may lose some of its discount, which is fine since I already own some.
Let’s also look at an example of a company that didn’t make the BUY list: Wells Fargo & Company [WFC]. I wrote this company up as “almost good enough, but not quite.” Current earnings are $7.833 billion and analysts are projecting a growth rate of 11%. Let’s assume for the time being that WFC will manage 11% per year for 10 years then, like before, slide into a 6% per year growth rate. We apply the 15% discount rate for 10 years and the 12% afterward just like before. The raw picture looks pretty similar.
 30 years of present value analysis of Wells Fargo & Co [WFC]. The overall chart does not look much different from LECO. This stock is growing well, and would probably be a good buy but present value analysis gives us a way to compare it to the market price and see if it is a good deal.
When we add up the numbers we get a present value for WFC of $129 billion; subtract long term debt of $80 billion, add the cash and receivables of $45 billion, and you arrive at a net present value of $94 billion. Divide that by 1.68 billion shares outstanding and you get a net present value per share of $56 on a stock currently priced at $67 (May 25th, 2006). This stock is what I would call “fully priced.” The shares are not cheap for what you are buying and any decrease in growth from the hefty targets will hit the stock very hard. This is a good company, but any stock stops being a good buy if the price goes high enough.
What discount rate to use
The WFC example we just did arrives at a net present value of $56 for a stock trading at $67 and yet some analysts have a “buy” on the stock. How can that be? It stems from the effect of the discount rate. If I go back and rerun the WFC analysis with an 11% discount rate all the way through (instead of using 15% for the first ten years) I arrive at a net present value per share of $114! The differences when compounded over a long time can be quite significant. For this reason it is obviously quite important to use the right discount rate. A lot of research has gone into determining the right discount rate and the answer any expert will give you is, “it depends.” One common rule of thumb is that the discount rate on stocks that has been calculated from historical data is about equal to the 10 year treasury yield plus about 6% (which is known as the eqity premium). Right now that would be 11% and that’s what many Wall Street analysts seem to be using. You can calculate the discount rate investors must be using by doing the reverse of the calculations I went through above (this is then called the implied discount rate) and many people are watching that as a measure of how fairly the market is priced. The number varies from 9% to 17% depending on sector and class of stock (as of this writing and leaving out a lot of complicating factors). I like to use 15% because it means that even if the analysts are overly optimistic, imagine that, the stock still has a bit of a cushion and we can sell to the 11% crowd.
Another way of looking at the discount rate is how much you enjoy risk. A stock trading down near an 11% discount rate has a lot of risk and should be much more sensitive to bumps in earnings and news, whereas a high discount stock has more of a cushion. Higher discount stocks are harder to find, and you have to do your research, but that is where profits lie.
Conclusion
Don’t buy stock purely on a net present value analysis. It’s an excellent tool, but you need to also look at the business, understand the realism of the growth potential, and be aware of any special sector concerns (for example many people would take issue with my analysis of WFC above, since banks typically don’t have their debt subtracted and I left out asset considerations for simplicity).
An excellent way to start analyzing a stock is to start with a net present value analysis, then start asking yourself questions about all the components that go into it (the growth rate, the debt, the receivables). If you do all that you’ll be ahead of 99% of the investors out there, and you don’t have to beat them all to make money.
Invest well,
The Finance Wonk
posted by FinanceWonk at 11:31 PM
![]()
![]()

4 Comments:
In the common vernacular, this page rocks. Very nice.
Dear Friend,
I have seen a very good website www.onlimoney.com and found the recomendation is very fruitful its a fourm on which i can discuss stock and commodities sector.
Sign Up today at www.onlimoney.com
nice blog have some quality info given
one of the best blog i have ever seen
Post a Comment
<< Home