Bond Investing Strategies and Tips
I think bond traders are secretly pleased to have such confusing words attached to their profession, it allows them to hold their own in conversations where commodities traders are talking about “contangoes” or stock traders are “shorting against the box.”
Most of those words can be explained in straightforward terms and I’ve tried to write this article for people who don’t know the jargon without skimping on discussions of advanced tactics and strategies. If you already are a bond whiz you can just skip the bits defining the terms and you’ll still probably find at least one neat tip here. If you haven’t tried to buy bonds before, or if you have but don’t have a full understanding of what is happening with those investments this article should clear up a lot of the confusing doublespeak that seems to surround bond trading.
Bond basics
A bond is basically debt. An issuer is the company or government who borrows the money by issuing the bonds – at which point the buyers pay for the bonds and the issuer gets the money. When originally sold the bonds will be sold in some fixed unit size (such as $1000) with a stated interest rate (let’s say 6% for this example). At 6% the issuer will pay the owner of the bond $60 per year (generally paid in parts every X months) until the “maturation date” at which point the borrower will give the bond owner his $1000 back and the bond will cease to exist. A bond is basically debt with interest. The difference between a bond and a direct loan is that a bond is easily traded in standard unit sizes and typically the bond has a standard contract form.
Bond types
The basic bond types that most people talk about are government and corporate.
The least risky government bond is the US Treasury bond. The US government has the amazing advantage of being able to borrow in its own currency, so the bonds will presumably always be repaid since the US can simply print any needed money. (As an interesting aside the Republican Congress actually threatened to stop payments on US bond obligations in the 1990s during a budget showdown with Democratic President Clinton, but everybody eventually realized that would be a horrible precedent and so to this day US treasuries have never missed a payment.) A few other countries have managed to borrow in local currencies, but most other countries and emerging economies wind up borrowing in bonds denominated in foreign currencies (usually dollars).
The result of this currency difference is that when the borrowing country’s economy has a slowdown their currency weakens and suddenly it becomes much more expensive (in local currency) to make debt payments at the same time as the local economy can least handle higher payments. This vicious cycle has shown up a number of times and has caused several recent bond market disasters such as the Argentinean, Russian, and Southeast Asian collapses of the last few years. Emerging nations have responded by building larger dollar currency reserves so that they can pay off their debts with dollars when difficulties arise, thus defending their currencies.
The second major bond type is corporate bonds. These bonds are issued by companies to raise money for business purposes. Some of these bonds have additional conditions that you don’t typically see in government bonds, such as “call rights” that allow a company to buy back the bonds at certain times (paying back the base debt amount, but depriving the owner of future interest) or “conversion rights” that allow the bond owner to convert it to company stock under certain conditions. Corporate bonds have more variations and are a somewhat wilder bunch than conventional government bonds.
This explanation has focused on the major categories and types. There are also government bonds issued within larger countries (including the US) by states and even by cities. These bonds carry various terms and exceptions and in many cases have different tax consequences.
Bond Price Changes
There is a basic relation between a bond price and the interest rate on that bond. When the interest rate goes up, the price goes down. When the paper says “bond prices strengthened today” you can tell without reading further that the interest rates available are lower. The simple reason for this is that the debt payments on a bond are based on the original issue price, so if Arnold buy a $100 bond from Bob for $105 for whatever reason, the interest the issuer is paying is still based on the issue value of $100. If the bond originally offered 5% on $100, that’s a $5 payment. The payment is still $5 but if you buy it for $105 you are making 5/105 = 4.76% because the price went up.
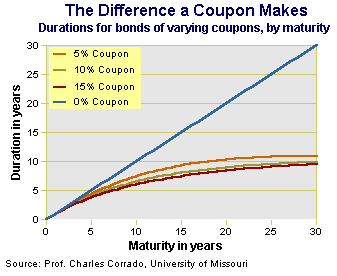
This price/interest rate relationship is clearest for US treasuries, where the price changes presumably do not reflect changing evaluations of risk (recall that the US treasury is largely considered “riskless”). These interest rates reflect the price the US government pays to borrow money, so it’s also an important value for economic forecasting. When the prices of treasury bonds change it is a relatively straightforward bit of math to calculate the accompanying interest rate change. The relationship between these two is called the “duration” for historical reasons. Don’t let the name fool you, the “duration” of a bond is not the amount of time between issue and maturation or the amount of time remaining on a bond before the capital is returned. The duration is the multiplier that is applied to an interest rate change to figure out the price change of a bond. If you own treasury bonds with a duration of 7 and you read that the interest rate on your bonds went up 0.25% you should expect the market price of those bonds to DROP by 7x0.25% = 1.75%. (This is a large jump, bonds move slowly most of the time.) The image below shows typical duration changes as maturity changes for different types of bonds. The “coupon rate” is the percentage yield payments the bond is making each year. (These used to take the form of coupons that were cut off the bond each year and cashed in.) You can see that for most reasonable coupon rates duration maxes out at about 10 (and yes, the standard units of duration are years – don’t let it confuse you). This means that for a bond of 30 year maturity (and thus duration of about 10) you would expect an interest rate change of 0.25% to result in a price change of -2.5%. One interesting exception to the duration calculation is that bonds which do not make payments (so called “Zero coupon bonds”) have a duration equal to their time to maturity.

Bond "duration" (the variable) versus bond "maturity" (number of years until the bond is finished and the principle is returned. The duration is a handy number that you multiply the interest rate change by in order to get the market price change of a bond. If duration is 10 and a bond yield drops 0.25%, the price on the market should go up about 2.5%
Bond yield and maturation
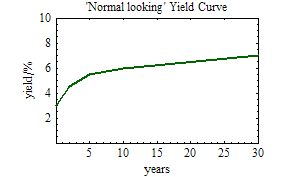
Bonds typically return a higher percentage rate (or yield) if they have more time until maturation. Another way of thinking of this is that people want a higher interest rate if they are going to lend money for longer. A longer term loan involves more risk that the borrower will default, or that interest rates will change, or that the lender will find a better potential use for their money. In our everyday lives this manifests as cheaper loan rates for a 15 year mortgage versus a 30 year mortgage, for example. A chart of these rates (known as yields) forms a curve and is known as a yield curve.

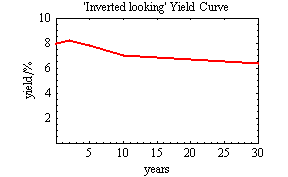
The relationship between bond maturation date and interest rate changes over time. It is influenced by the market demand for bonds and also by estimates of what the prevailing interest rates will do in the future (if you think interest rates are going to go up in a few years, you will want a higher rate on a loan that extends into that time). Sometimes, however, prices fluctuate such that interest rates on longer loans become LOWER than interest rates on shorter rates. This is known as an “inverted yield curve” because the relationship between the future and present yields is the inverse of the usual relationship. When the short term and long term yields are about equal we get what is known as a “flat yield curve”.


Advanced strategies
Take a moment to look back at the normal yield curve above. A 10 year bond normally trades at a higher interest rate than a 5 year bond, so what happens if you buy a 10 year bond and hold onto it for 5 years? You will collect the interest for 5 years, but you will now be holding a bond which will be paid off in 5 years which means that the market will value it as a 5 year bond. The interest payments remain the same, but since the market now values the bond as a 5 year bond it will probably trade at a lower effective interest rate and since prices of existing bonds move in the opposite direction of interest rates the price goes up. Another way of looking at that is that once a bond (any bond) has lived part of its life it becomes a shorter term loan and becomes more valuable since more people are willing to loan shorter term money. The increase in price of an aging bond is called “roll up.”
This strategy becomes more useful when the yield curve is steepest, because a larger change in interest rate leads to a larger increase in price. When the bond curve is flat you can buy long bonds and wait for them to age while the bond curve gets normal again and try to profit from both events.
The Carry Trade
When the yield curve is steep the bond roll up strategy above is widely practiced. The "carry trade" is the opposite strategy: it is widely practiced when the yield curve is inverted. When the curve is inverted an investor can borrow long-term money (by selling long term bonds short to generate cash for the strategy) and then loan short term money by buying short term bonds. The lower shield on the long term bonds means that more money is made from selling those bonds than by buying the short term bonds, resulting in profits. When the maneuver is completed the investor is left holding short term bonds and owing long term bonds, which is fine as long as the prices balance somewhat but can leave the investor owing money if the yield curve reverts to its normal shape. During the recent yield inversion a lot of hedge funds practiced this strategy, and some of them lost some money when they didn’t get out in time.
To further enhance the carry trade some market players also use different types of bonds for the two parts of the transaction. One recent example was that hedge funds were borrowing their money in Japan at nearly 0% and loaning it in Iceland and Turkey at 3-5%. It was possible to make a lot of money this way, but currency changes and bond market volatility make the strategy risky.
Bond risk
Each bond has some chance of default, which means that it will not be paid off. The US treasury bond is usually used as the “riskless” standard so you will often see comparisons of bond returns made to US treasury bonds or see the US treasury bond referred to as “the riskless asset”. Corporate and government bonds are usually given risk ratings by a number of rating agencies such as Standard & Poor or Fitch rating services. The rating names vary by agency but most are alphabetic and if you see something that starts with anything other than an “A” you should be very wary, the grades are not like school and a “B” is not very good.
The rating agencies use proprietary (and secret) grading methods and companies pay them for the ratings. This has led to some concerns about accuracy and conflicts of interest. The agents of the rating companies are essentially auditors who go into a company and give a credit score based on the books of the company. The rating companies argue that they have to keep their scoring methods secret in order to prevent people being able to reverse the rating to extract non-public information that rated clients have shared with them, but investor advocates have expressed a lot of concerns about the rating agencies keeping methods secret and accepting payment from their audit subjects. Academic studies have shown that the rating agencies are often 2-3 years late in spotting dangerous financial trends at their subject companies.
Fortunately there are alternatives.
I could fill pages and pages with academic debt rating methods, but the most widely used method is the “Altman Z-score” or simply “Z-score” introduced in an academic paper in 1968 by Altman [click for paper]. This score is calculated from publicly available numbers which can be extracted from the published financial statements, although it often requires quite a bit of accounting dexterity to get some of the numbers if the company is complex and has a conglomerated structure or joint endeavors with other companies. The resulting score is the corporate equivalent of a “consumer credit score” of the type that companies maintain on each of us individually. The Z-score has an advantage of being publicly reviewed and criticized so that a lot of people are constantly investigating the Z-score and looking for weaknesses or corrections that might be needed (a quick search found about 150 study papers using the Z-score for comparison or proposing extensions to the Z-score). This review makes the Z-score a very powerful method. Whenever I am concerned about the ability of a company to pay off its debt I calculate a Z-score for the company. [Link to an online Z-score calculator]
The availability of both the private rating agencies and the publicly reviewed Z-score raised a natural curiosity: how do they compare? Several studies have been done along these lines. If you go to this post you can see a chart of how Standard & Poor ratings have equated to Z-scores over time. As the financial system has changed both S& P and the Z-score users have slowly adapted their criteria to adjust for changes in how companies operate and how financial reporting works. The most interesting outcome from comparison studies is that the Z-score changes well before the rating companies adjust their scores, in fact the Z-score typically projects S & P downgrades almost 3 years in advance! To some degree this is understandable since the auditors at the rating companies only visit the company occasionally (remember they have to be paid), but I was surprised that the delay was so long. The next time you read about a bond declining in the market without any rating changes, keep in mind that rating changes are often delayed several years after company problems are visible in financial statements. If you invest in specific corporate bonds you may want to calculate a Z-score every time they release earnings.
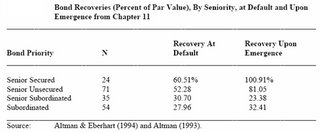
Common stock typically becomes worthless during the bankruptcy process because stock represents ownership in the business. Bonds are a loan to the business so typically bondholders recover some value during a bankruptcy. There are a variety of levels of “seniority” of bonds, the more senior the bond the more firm a claim they represent on the assets of the company. I have reproduced a chart from a study showing the average value recovered during a bankruptcy by the various bond seniority levels.

Bond Trading
Bonds are traded differently than stocks. For many years the market was hidden from investors and a broker would give a price without the investor knowing how much of a markup they were facing because there were not central quote interchanges available. Bonds were traded between the “bond desks” of large institutions and many times the markup on a bond purchase (versus the price the seller gets) could be several percent of the total price! Things are getting much better now with numerous bond supermarkets making some level of quotes available. An investor typically still pays more for a bond trade than a stock trade, but it isn’t nearly as bad as it used to be.
One thing to watch out for is expressed in the old saying that “stocks are bought and bonds are sold.” In many cases bonds (being debt) are pushed quite heavily by investment banks either to clear up their portfolio or to serve a corporate client (for some frightening stories about this see the book “Liar’s Poker”, linked below). If your money manager tries to SELL you a bond, you should become skeptical and carefully review the purchase (and consider changing money managers). The right way to BUY bonds is to come up with a fair idea of what qualities you want and have a look at the available bonds – and if you have enough capital to allot buy several different bonds for diversification. You should also be careful where you buy bonds and be aware of the specific compensation any intermediaries are collecting. I encourage you to click on some of the bond market ads that no doubt show up on this page, but be careful and make sure you are BUYING and not BEING SOLD.
Bond Expertise
Any investor who knows the material above is far ahead of the average bond investor. If you can look into a Z-score (and know how far behind S&P type credit ratings can be) and you know what duration is you will find even many bond articles in the financial press to be humorously ill-informed. The most complex math involved here is only multiplication so you can quickly do checks in your head when looking at the yield, maturation, and price of a bond to consider for investment.
There are still a lot of things that have not been mentioned here. Some corporate bonds have complex terms where the yields follow various indexes, for example. Some regional government bonds are “pre-refunded” where they have a pile of treasury bonds that are sufficient to pay off the bond sitting in a trust – those regional bonds cannot fail to pay unless the US treasury bonds fail. Other bonds may have “insurance” which means that even if the payer fails another company or bank will stand behind the bonds (although that payer may fail as well). There is plenty of room for further reading; the material here is designed to give you a solid foundation to start from.
Link to the book "Liar's Poker" which gives an insiders look at how bond selling floors work at banks:

2 Comments:
Great tips.
- Michael Ivanov
Just remember that even though bonds are usually a safe haven, even bonds can face difficulties
Post a Comment
<< Home