Will Debt Zombies or Retiring Boomers crush large cap retailers?
It sounds like a monster movie: "Year of the Debt Zombies." In a January 4th article the Wall Street Journal declared that consumers are in so much debt that as interest rates adjust upward they will be forced to cut back on spending, causing pain and suffering to the big retail companies that sell everyday goods.
Why people are worried about debt and the consumer: The plot immediately below (reproduced from the Wall Street Journal 1/4/06) shows the consumer personal savings rate. It suggests that the american consumer spent more than they made in 2005 for the first time since the great depression.
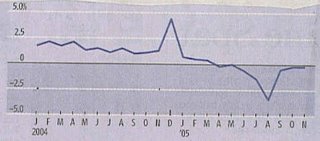
Personal savings rate as a percentage of disposable personal income, seasonally adjusted data. (Source: Bureau of Economic Analysis)
One of the conclusions that people draw from this is that people are spending beyond their means and will have to cut back when interest rates on borrowing rise.
- Scenario: Consumers are borrowing to spend
- Outcome: As rates rise, consumer spending cuts back and pinches sales
- Winners: Small caps with niche products, growth over value. Ipods over washing machines.
- My Opinion: This data has problems, but the trend may be right, keep reading
Lets put on our data scrutiny caps: The Bureau of Economic Analysis computes these numbers in a way that has some holes in it. The income number, importantly, only includes salary. This means that as the capital wealth of the U.S. population (interest from savings, dividends, stock holdings, real estate) increases over time we would expect the plot above to slowly trend downward. If you, dear reader, have significant dividend or rental income and are spending some of that income, you may show up as a negative saver on the chart above, even if you are actually putting away some money each year. I personally make all my money from non-salary sources so every dollar I spend contributes to the "negative savings" of the US consumer even though I actually build up my savings on a year-to-year basis. Two decades ago this hardly mattered as most Americans would never consider owning stocks, but today dividends and capital assets like homes and stocks make up a significant portion of the financial landscape,so it seems like we should read this data with skepticism. In short even after looking at this data it is quite probable that the consumer can be spending this much while still building up total net worth.
Don't get me wrong here, I think increasing rates will impact consumer spending. I just don't agree with the exact data used for the analysis above. Lets look at the effects of a drop in home refinancing. Last year 80 percent of refinancings included cash out of at least 5%, pumping a total of about $243billion into the economy (reference). That will probably be down by at least half for 2006. The overall consumer spending amount is about $6.6trillion each year, of which about $3trillion is "discretionary" (read: optional stuff like TVs and movies, as opposed to food and medicine). Removing half the cash out refinancing would remove 4% of discretionary spending. Try taking 4% out of the projected sales growth of your favorite consumer companies and the picture isn't good. Some of them swing to a loss if their top line costs don't scale. Of course, some of that cash out may have been spent on food, so let's call it a straight 1.8% decrease in total consumer spending:
- Scenario: Cash out refinancing dollar volume is down by 50% in 2006 (as projected by Freddie Mac)
- Outcome: Consumer spending is 1.8% short of the cash it had in 2005
- Meaning: Reduces growth of consumer goods companies like Anheuser-Busch, McDonald's, Nike, and the like...
My advice based on this would be to moderate your expectations for any company that doesn't have significant pricing power.
Digging deeper, more on the decrease in savings: While we have discussed reasons to be cautious of the savings data above, we can extraxct useful information from it. Wages are stagnant so the chart on savings, once we know how the data works, tells us that people are still spending more without getting raises. What's going on here? Allow me to introduce you to a graph I think sees far too little attention: spending by age.
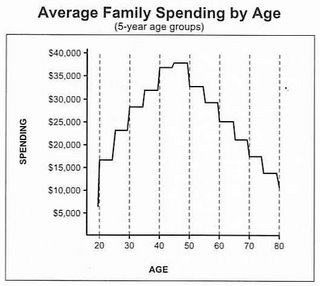
Spending of households as a function of the age of head of household, data from U.S. Bureau of Labor Statistics, Consumer Expenditures Survey, 1989
This plot shows how much money people spend (consumer spending) based on their age. The plot is probably not all that surprising if you think about it in bits. Somewhere around 20 a person gets their first "real" job and their cash flow jumps up considerably. A person makes (and spends) more money as they advance in their career and raise a family, and they spend less in retirement as they try to stretch their savings. In particular it shows that you would expect someone to be at their spending peak around their mid 40s. What does this mean when we compare it to birth data and the age of the population? This question was addressed by Harry S. Dent in his book "The Great Boom Ahead" where he compared generational savings and spending patterns to the market. I won't steal his thunder by discussing his assertions about the stock market but I will reproduce a portion of one plot of his from my highly scribbled in copy:
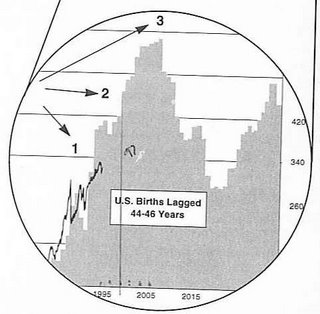
Spending projection based on spending by age and population data. From "The Great Boom Ahead" by Harry S. Dent.
This image shows the total U.S. Birth count from census data, lagged by about 45 years to show projected waves of maximum spending. You will note that it shows a wild spending crescendo in the 2005-2007 range as the baby boomers finish up their high spending levels before retiring. Comparing this to actual spending data is a little difficult since there are so many ways of reporting spending data, but this chart looks pretty good - and I don't say that very often. This trend even explains the low apparent savings rate from the beginning of this post by showing how the people with the most accumulated capital savings (which doesn't count as income in that data) are also at their spending peak.
- Scenario: Boomer retiring reduces consumer spending as suggested by Labor Statistics data
- Outcome: This has a much higher projected impact than reductions in housing refinancings, on the order of 10-15%. It's hard to believe that we would see a true 10% drop in consumer spending, but the data suggests a major effect
- Winners: Niche product makers who sell to aging boomers (Thor industries, Winnebago), medical stocks (Pfizer, Merck, Medtronic)
- Losers: Those who count on high total consumer spending: credit card companies, big retailers
In the final analysis I think the generational trend explains much of the consumer savings data and also shows caution for the future. It shows a dramatic slowdown in spending around 2007, which I think we all need to be ready for. The impact could be quite large.
posted by FinanceWonk at 9:32 AM
![]()
![]()

1 Comments:
Whoah!
Post a Comment
<< Home